A clinic can generate hundreds of transactions every month and still leave its management with one difficult question: What is actually driving our revenue?
The answer is rarely found in a single billing report. Revenue is connected to patient visits, appointments, doctors, services, pharmacy, and day-to-day clinic operations. When these numbers sit in separate places, it becomes difficult to identify patterns or act on them quickly.
Clinic revenue analytics changes that. With FelixaTouch, management can bring revenue and operational data together to understand not only how much the clinic is earning, but also what is influencing that performance.
Revenue Data Should Help You Make Decisions
A total revenue number tells you what happened. Analytics helps you understand why it happened.
FelixaTouch Revenue Analytics allows clinic management to look at revenue across different sources and time periods, helping identify changes in performance without depending entirely on manually compiled reports.
Instead of asking
“How much revenue did we generate this week?”
Management can start asking
- Which areas contributed to it?
- Are we using our available appointment capacity effectively?
- Where are we seeing opportunities to improve?
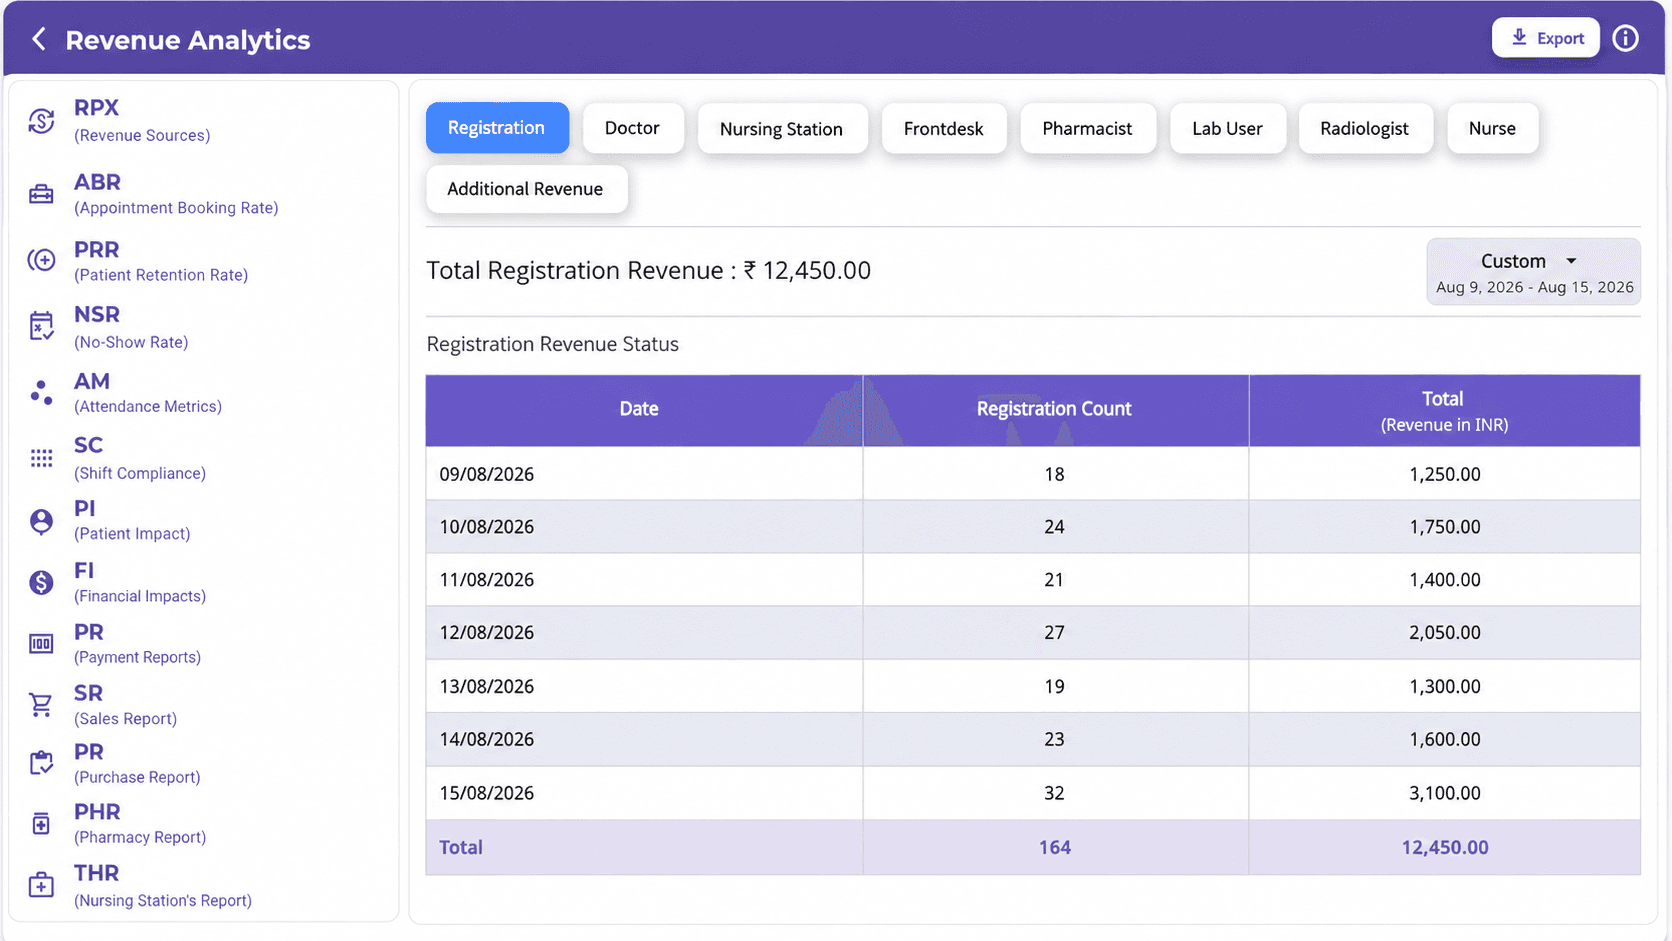
Screenshot 1: Revenue Analytics Dashboard / Revenue Sources
Break revenue down by source — registration, doctor, nursing station, frontdesk, pharmacy, lab, and more — over any date range.
Look Beyond Total Revenue
Two clinics can generate the same monthly revenue and have completely different business situations.
One may be growing through stronger patient retention. Another may depend heavily on a particular doctor or service.
RPX
Revenue per Registration
RPD
Revenue per Doctor
RPT
Revenue per Therapist
These indicators can provide more useful context than total revenue alone, helping management understand revenue contribution at a more granular level.
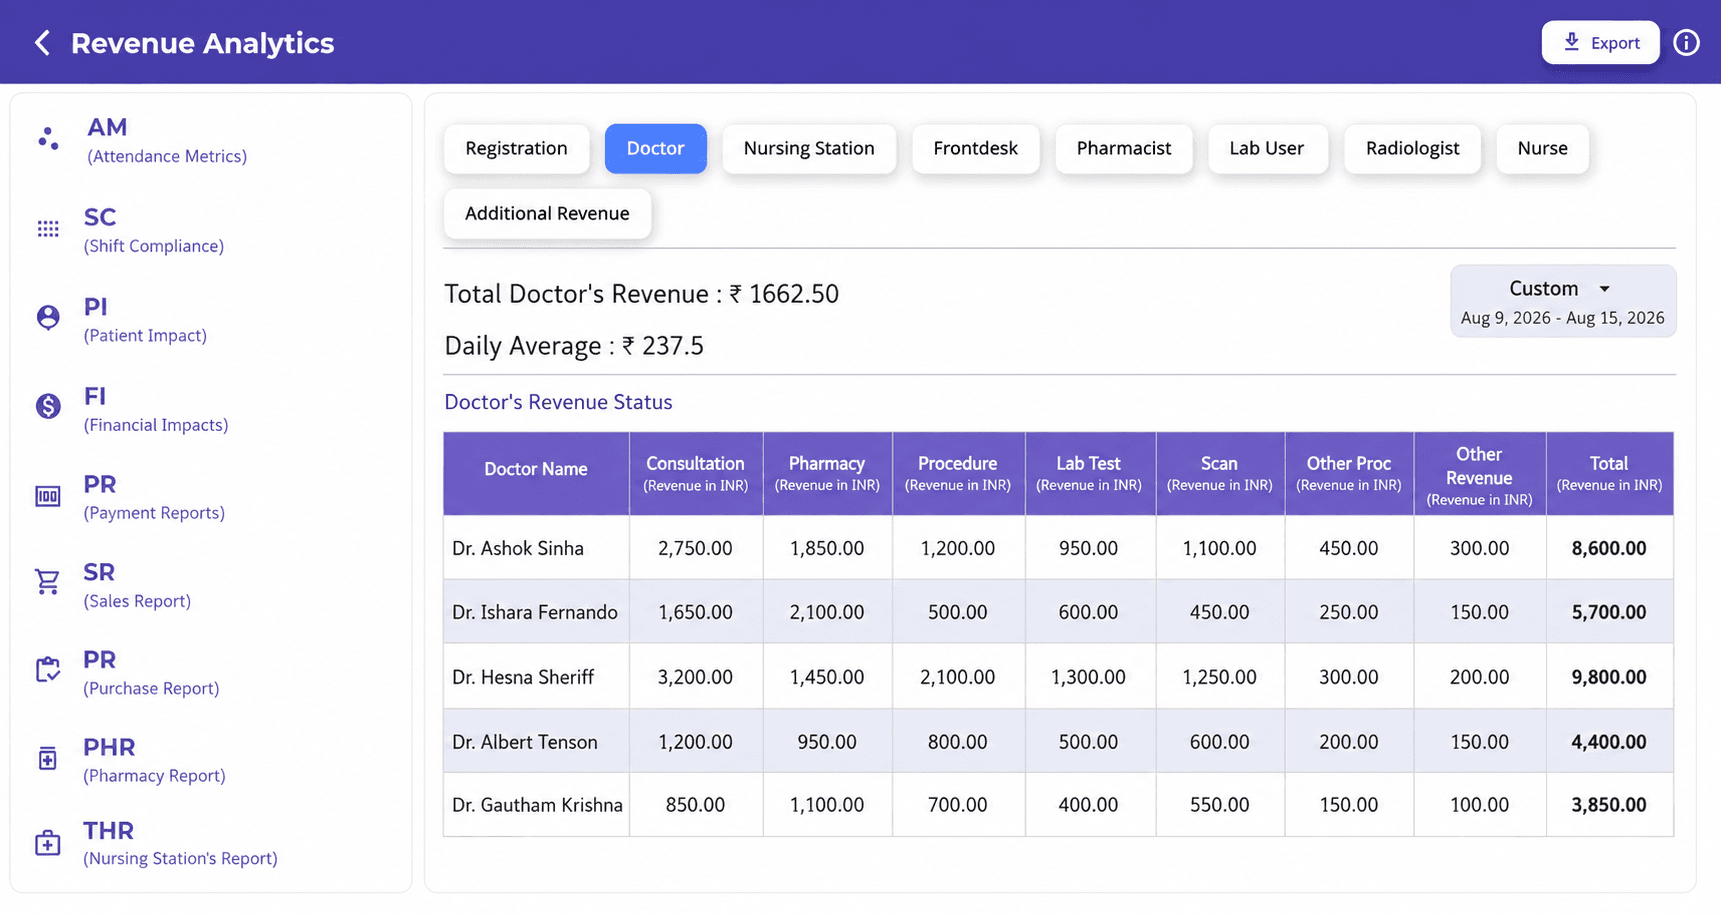
Screenshot 2: RPX / Doctor / Therapist Analytics
See each doctor's contribution across consultation, pharmacy, procedure, lab, scan, and other revenue.
Your Appointment Calendar Can Tell a Revenue Story
An empty appointment slot is not just an operational issue. It can also represent missed revenue potential.
FelixaTouch includes metrics such as Appointment Booking Rate, Patient Retention Rate, and No-Show Rate to help management understand patient and appointment behaviour alongside financial performance.
This creates a clearer connection between
Appointments → Patient Visits → Revenue
When these patterns are visible, clinic owners can make more informed decisions about scheduling, follow-ups, and patient engagement.
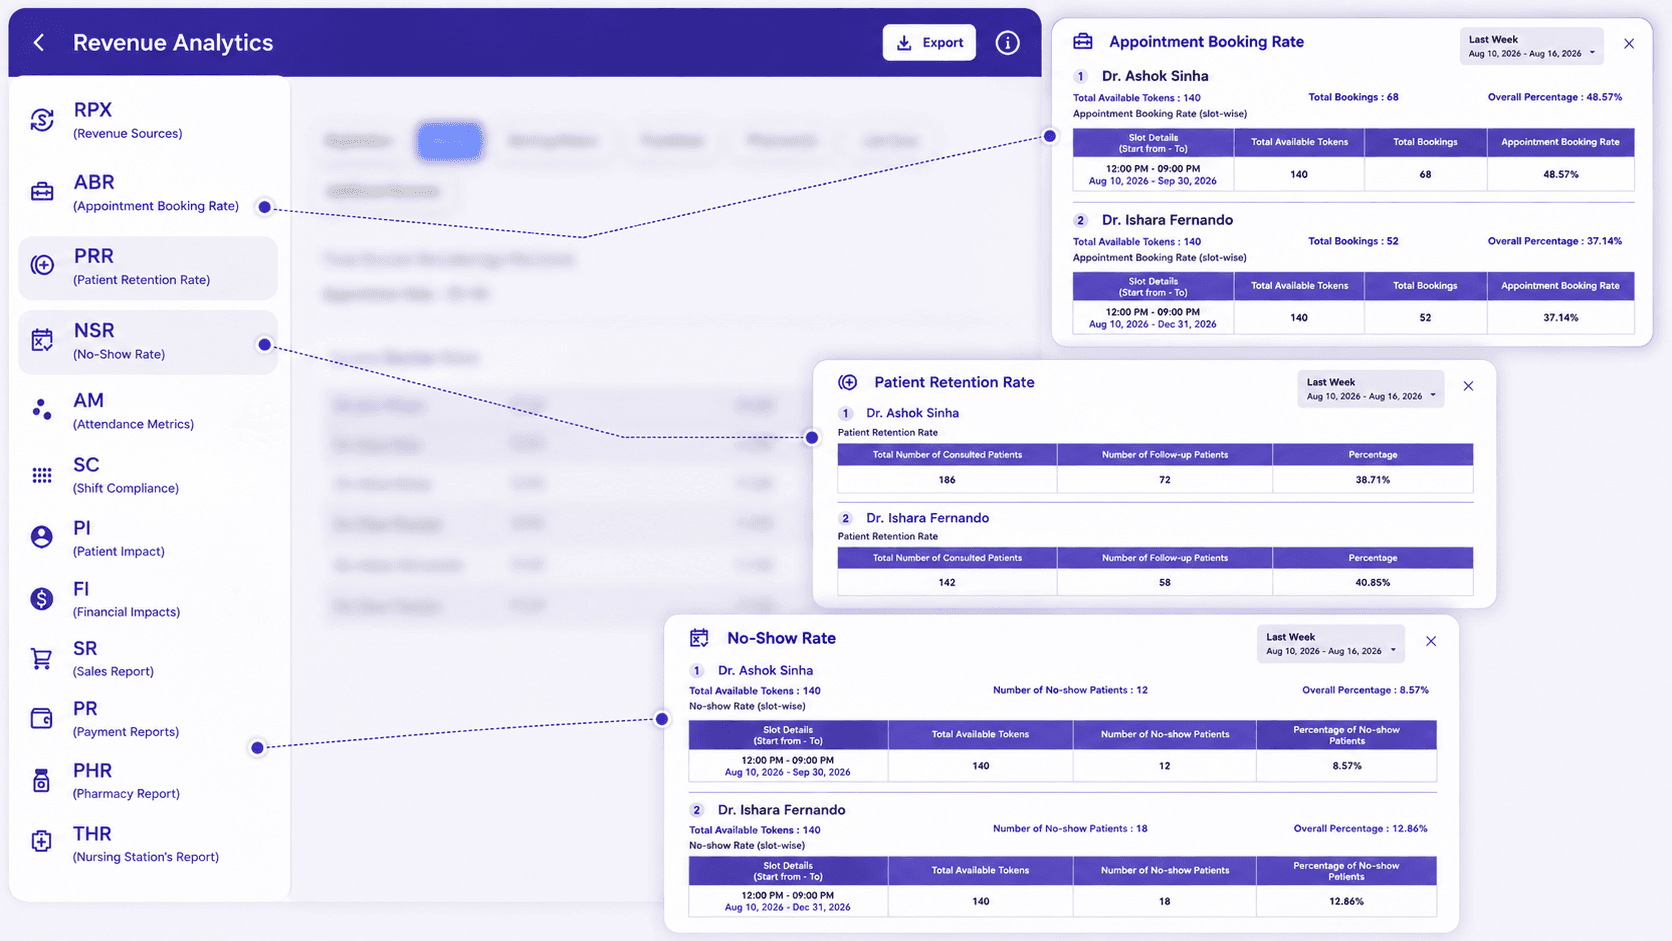
Screenshot 3: ABR / PRR / NSR Analytics
Compare booking rate, retention, and no-show percentages doctor by doctor and slot by slot.
Operational Performance Matters Too
Revenue performance does not happen independently of the people and processes running the clinic.
Attendance, punctuality, shift compliance, and schedule adherence can influence how efficiently a clinic uses its available capacity. FelixaTouch analytics brings these operational indicators into the broader performance picture, allowing management to identify patterns that may otherwise remain hidden in day-to-day activities.
The result is a more connected view of clinic performance — rather than treating revenue, patients, appointments, and staff productivity as completely separate areas.
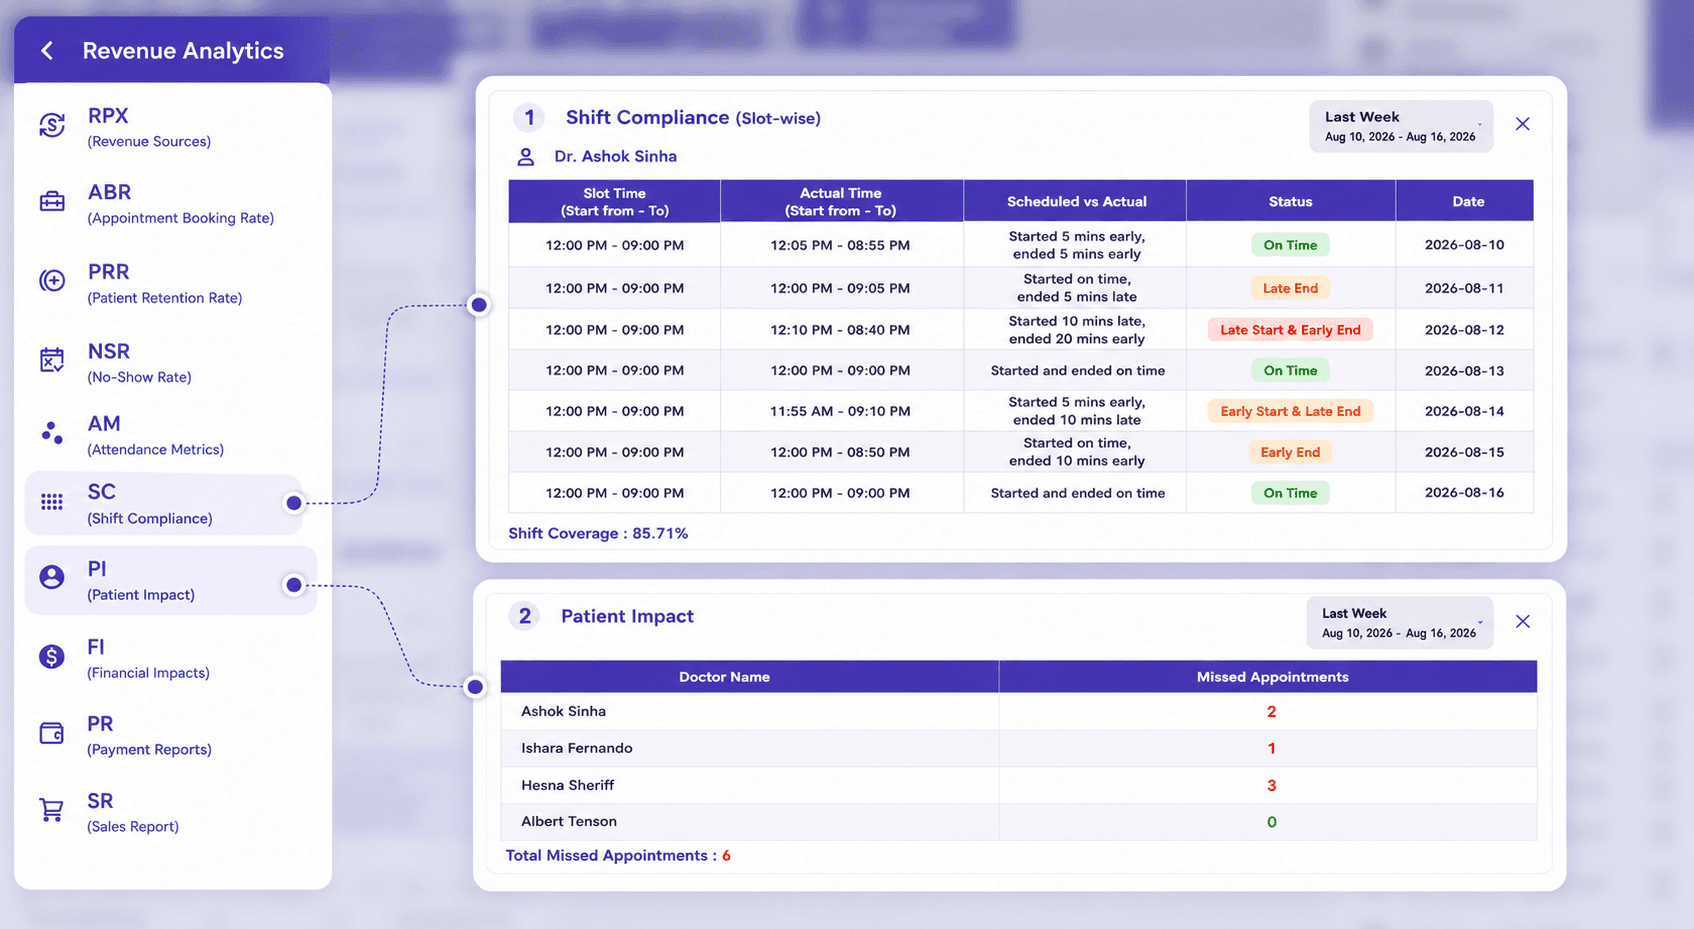
Screenshot 4: Attendance / Shift Compliance / Productivity Analytics
Track slot-wise shift compliance and the missed appointments that follow from it.
From Numbers to a Clearer Business Picture
The real value of revenue analytics is not the number of metrics on a dashboard. It is the visibility those metrics provide.
With FelixaTouch, clinic owners and administrators can analyse revenue sources, patient activity, appointment performance, and operational indicators through a unified analytics environment.
Pharmacy revenue can also form part of the overall revenue picture. Detailed pharmacy revenue and expenditure analysis, however, deserves a more focused view and will be covered separately through the pharmacy and inventory workflow.
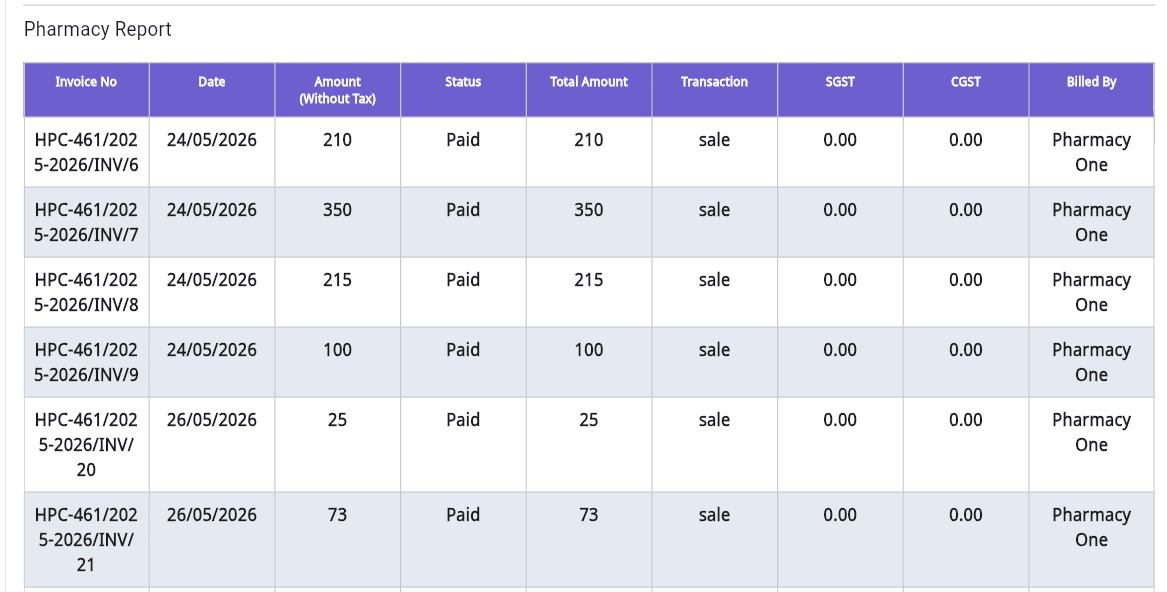
Screenshot 5: Pharmacy Report
Invoice-level pharmacy revenue with tax, transaction type, and billing user.
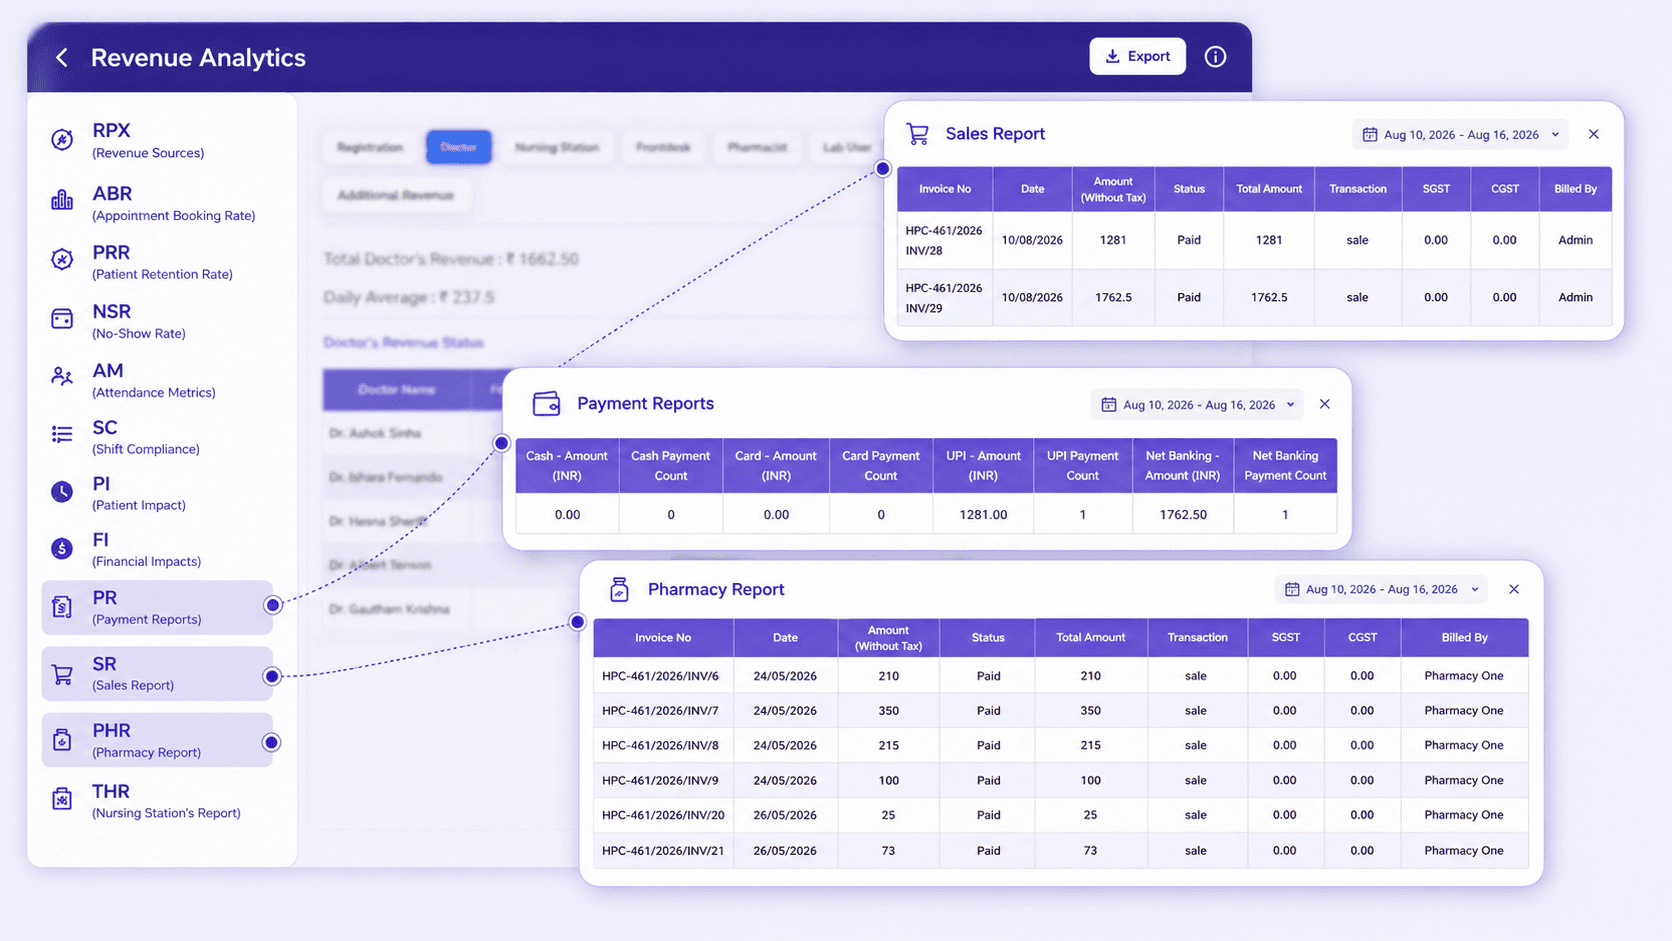
Screenshot 6: Analytics Categories
Sales reports, payment reports, purchase reports, and more — available from one analytics panel.
Run Your Clinic With Visibility, Not Guesswork
Clinic growth is not only about attracting more patients.
It is also about understanding how effectively the clinic is converting its available capacity, retaining patients, supporting its team, and generating revenue across its different activities.
That is where clinic revenue analytics becomes more than a reporting feature.
It becomes a management tool.
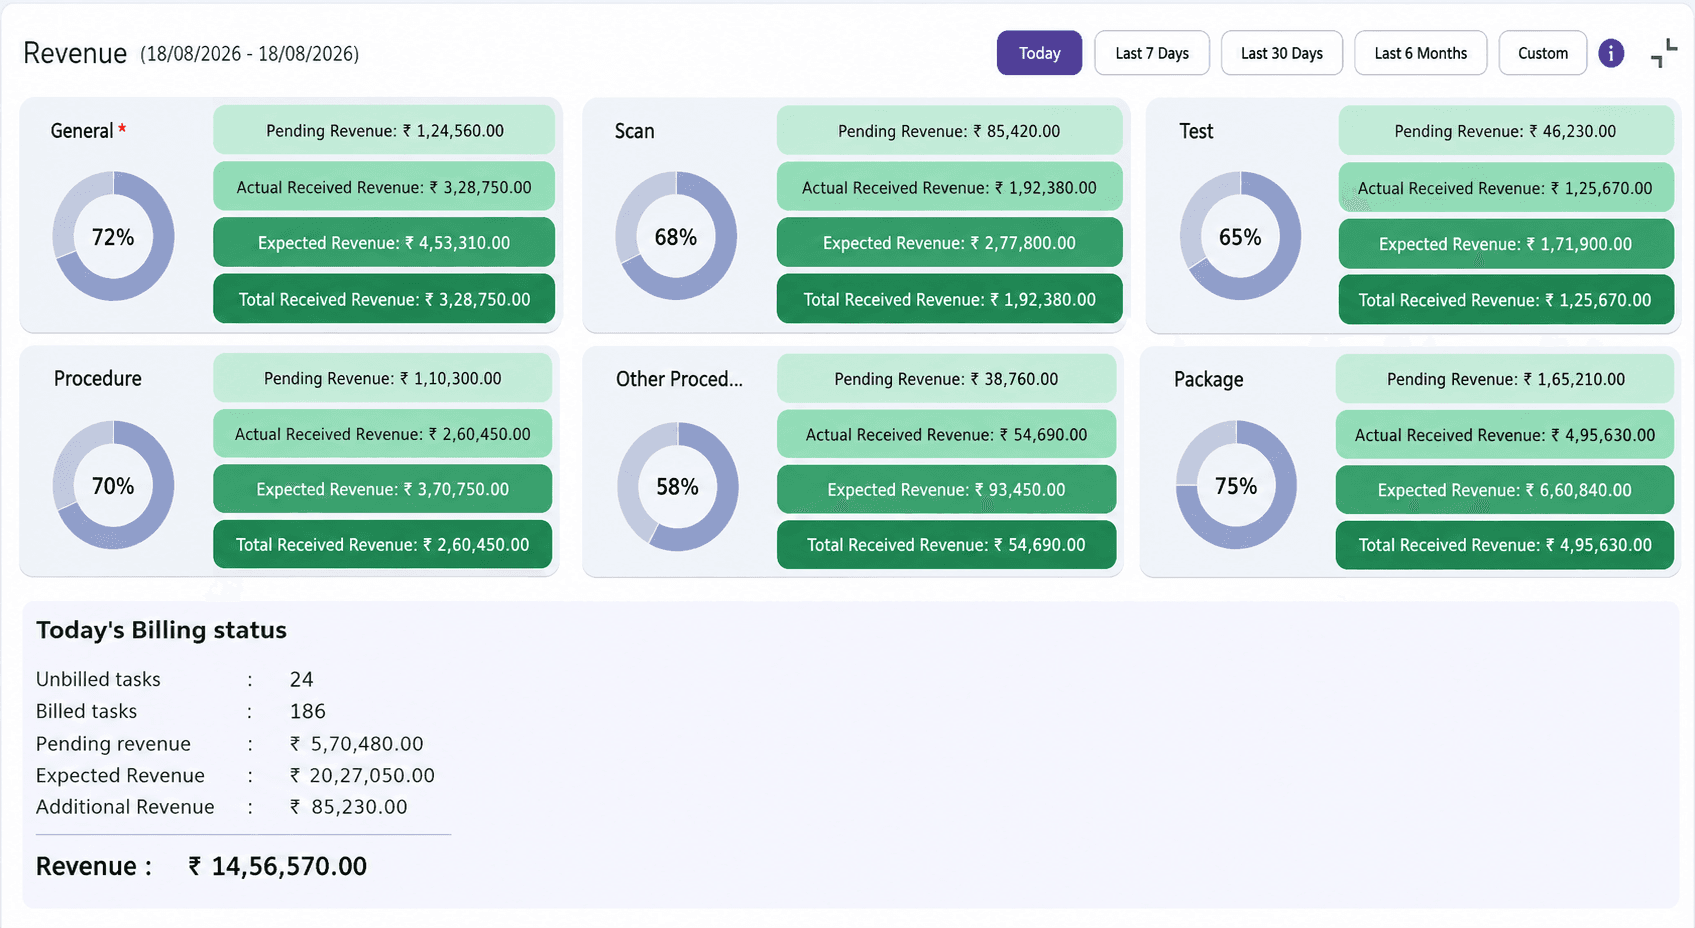
Screenshot 7: Graphical Revenue Overview
Pending, received, and expected revenue by category — with today's billing status at a glance.
Key Benefits of FelixaTouch Revenue Analytics
Why Choose FelixaTouch?
FelixaTouch combines revenue analytics, patient records, billing, appointments, pharmacy, and clinical workflows into one unified platform. Because the data is already connected, analytics reflects what is actually happening in the clinic — without waiting for reports to be compiled by hand.
Understand the Business Behind the Numbers
FelixaTouch helps bring these signals together so clinic management can move from looking at numbers to understanding the business behind them.
Because better clinic decisions start with better visibility.
Ready to See What Is Driving Your Clinic's Growth?
Book a free demo and see how FelixaTouch Revenue Analytics connects revenue, appointments, patients, and operations in a single view.